
[Day 6] 2024.11.29
The snow isn't over yet.

Cold air from
the northwest
colder than average
Additional snow and rain
1. Pressure system
[ 500hPa weather chart 2024-11-29 09KST ]
[ 500hPa weather chart 2024-11-29 21KST ]

Although the cut-off low has moved away, a new pressure pattern is establishing itself. An upper-level trough over the western part of the Korean Peninsula is expected to bring another round of precipitation — likely rain or snow — mainly to the west. Unlike the snow event on the 27th–28th, which was directly caused by the cut-off low, this system features a different mechanism. As the upper-level trough passes from the West Sea toward the peninsula, warm maritime air clashes with cold continental air already in place, leading to cloud development near coastal areas. Snowfall from this event is expected to be lighter than the previous one.
[ 850hPa weather chart 2024-11-29 09KST ]
[ 850hPa weather chart 2024-11-29 21KST ]

Isolines are densely packed in a northwest-to-southeast orientation, indicating a strong influx of cold air from the northwest. At the surface level, this is accompanied by strong northwesterly winds and a noticeable drop in temperatures.
[ Surface weather chart 2024-11-29 09KST ]
[ Surface weather chart 2024-11-29 21KST ]

Regions along the west coast and adjacent inland areas show a temperature–dew point spread (T–Td) of less than 3°C, suggesting potential for snowfall driven by sea-effect processes.
2. Clouds & Precipitation
[ Water Vapor imagery 2024-11-29 09KST ]
[ Water Vapor imagery 2024-11-29 21KST ]

In the morning, the upper layer of water vapor flowed into the Korean Peninsula, and the air pressure trough front-up airflow was strong, and in the afternoon, the upper layer became dry as the steam band fell east.
[ 2024-11-29 09KST ]
[ 2024-11-29 21KST ]

In the morning, widespread rain and snow occurred nationwide. By evening, precipitation weakened and shifted eastward, remaining mostly over coastal and mountainous regions.
3. Temperature

This is the Skew-T log P diagram for 09 KST on the 29th.
Using the moist adiabat, the maximum temperature on the 29th is predicted to be around 2°C.
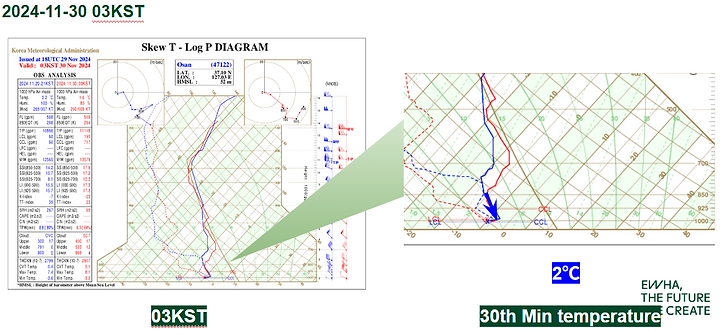
This is the Skew-T log P diagram for 03 KST on the 30th.
Using the moist adiabat, the minimum temperature on the 30th is predicted to be around 2°C.
4. Summary
- Temperature drop due to northwesterly winds.
- Precipitation such as snow or rain may occur under the influence of a trough.